Signals » Running VisualTrader's Analysis
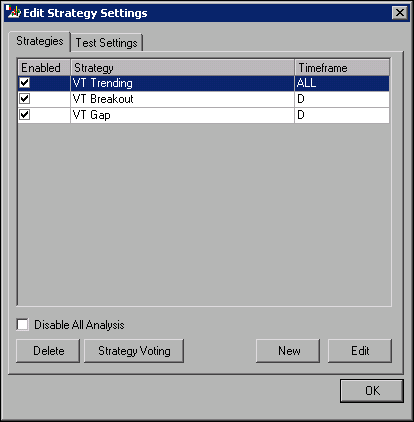
VisualTrader’s first and most important goal is to automate the market analysis and trading process as much as possible. You can set which strategies and test settings VisualTrader will use in your charts from the Strategies and Test Settings tabs on the Edit Strategy Settings dialog box. To open the this dialog box, select Edit » Strategies.

VisualTrader Edit Strategy Settings Dialog Box
The Opportunity List is the window of information that shows the results of VisualTrader’s analysis for each symbol in your profile. Each time you make a change to the settings in the Edit Strategy Settings dialog box or when you update data, VisualTrader will perform the necessary analysis for your changes and display the results in the Opportunity List.
VisualTrader also displays the following indicators in the status bar at the bottom of your screen to give you statistics on VisualTrader’s analysis.
- A—Specifies the percentage of all analysis VisualTrader has completed on the collected data.
- S—Specifies the average time in milliseconds that it has taken VisualTrader to generate signals for each symbol.
- P—Specifies the average time in milliseconds that it has taken VisualTrader to complete pattern analysis on each symbol.
- Q—Specifies the number of symbols VisualTrader has yet to analyze.
![]()
VisualTrader Analysis Status Bar
Click on any tool name to
see the help center files
by subject on that window.
- The Map
- The List
- Charts
- Signals
- Alerts
- Trading Tools
- Simulation and Playback
» Additional Tutorials
Access to electronic
services may be limited or unavailable during periods of peak demand, market
volatility,
systems upgrades or maintenance, or for other reasons. Symbols, prices, groups
and industries are used
for illustrative purposes only and do not constitute a recommendation.