Charts » Adding Line Studies
The chart tools menu gives you the ability to draw line studies on your VisualTrader charts. You can draw Trendlines, Support and Resistance Lines, the Rule of Eighth’s Lines, and Fibonacci Retracements.
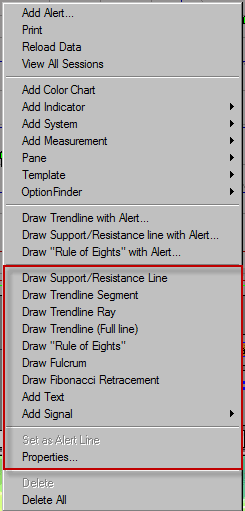
By right-clicking on a chart in VisualTrader, you are presented with a menu of Charting Tools.

Charting Tools Right-click Menu
- Draw Support/Resistance Line—Draws a horizontal support/resistance line that will continue to the right edge of the chart.
- Draw Trendline Segment—Draws a trendline with no extension
- Draw Trendline Ray—Draws a trendline that extends in one direction.
- Draw Trendline (Full line)—Draws a trendline that extends in two directions.
- Trendline with Alerts—Draws a trendline and lets you configure an alert for the trendline.
- Draw Rule of Eighth's—Draws either the Rule of Eighth's lines on the chart. The Rule of Eighth's option divides a drawn line into eight equal segments, using the Rule of Eighth's trade management tool. For more information, refer to the Profiting with Chart Patterns seminar by Ed Downs.
- Draw Fibonacci Retracement—The draw Fibonacci Retracement option plots the 38%, 50%, and 62% retracement levels from user-defined peak and valley levels.
- Add Text—Allows you to annotate the chart.
- Add Signal—Plots a signal and user-defined exits. Exits can be selected and edited by double-clicking on a plotted signal.
- Properties—Allows user to edit line styles of selected line.
You can also select a drawing tool or delete all of the drawings on your chart by right-clicking on the chart and using the menu that appears.
Editing the Properties of a Selected Drawing Tool
There are two methods for accessing the line properties of each drawing tool:
- Right-click on the drawing tool once it's drawn on the chart and select Properties.
- Double-click the drawing on the chart to load the properties window.
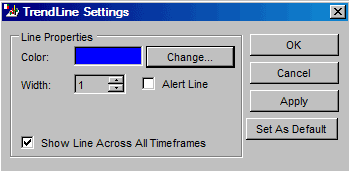
The Drawing Tool Properties dialog box will appear on the chart.
There are two methods for accessing the line properties of each drawing tool:
- Right-click on the drawing tool once it's drawn on the chart and select Properties.
- Double-click the drawing on the chart to load the properties window.
The Drawing Tool Properties dialog box will appear on the chart.

Drawing Tool Properties Dialog Box
- Color—Changes the color of the line study on the chart.
- Width—Controls the width of the line in the chart.
- Alert Line—Allows user to set the line as an active alert.
- Show Line Across All timeframes—Enabling this option will allow the line study to be plotted across all timeframes that are available in the profile.
- OK—Saves the changes made to any of the properties.
- Cancel—Cancels any changes that were made to the property settings.
- Apply—Click this option to save and apply any changes made to the properties.
- Set as Default—Saves the edited properties to be applied each time the edited study is drawn on a chart.
Click on any tool name to
see the help center files
by subject on that window.
- The Map
- The List
- Charts
- Signals
- Alerts
- Trading Tools
- Simulation and Playback
» Additional Tutorials
Access to electronic
services may be limited or unavailable during periods of peak demand, market
volatility,
systems upgrades or maintenance, or for other reasons. Symbols, prices, groups
and industries are used
for illustrative purposes only and do not constitute a recommendation.