Charts » Chart Options Chart Tab

Chart Options Dialog Box
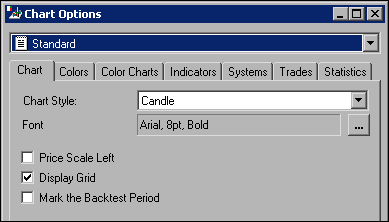
The Chart tab contains the following options:
- Chart Style—Select from Auto, Bar, Candle, or Line.
- Font—Sets the font, font style, and font size for your charts.
- Price Scale Left—Displays the price scale on the left of the chart. The default is to have the price scale on the right of the chart.
- Display Grid—Plots a price grid on your charts.
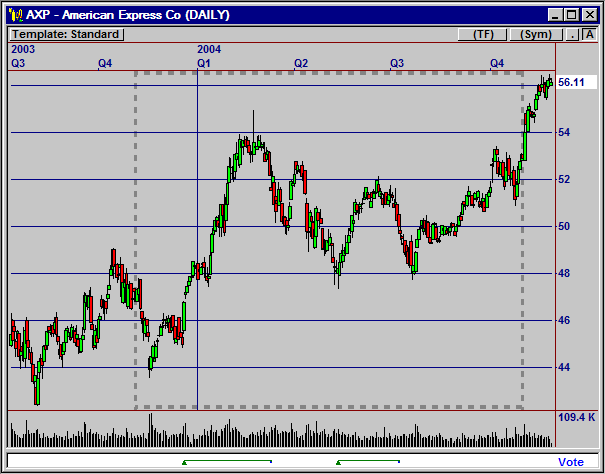
- Mark the Backtest Period—Shows the data range that is used for back testing, as defined on the Test Settings tab of the Edit Strategy Settings. The back test period is represented by a dashed line around the back test data set.

Back Test Period Marked on the Chart for AXP
» Help Center Home
» Additional Tutorials
Click on any tool name to
see the help center files
by subject on that window.
- The Map
- The List
- Charts
- Signals
- Alerts
- Trading Tools
- Simulation and Playback
» Additional Tutorials
Access to electronic
services may be limited or unavailable during periods of peak demand, market
volatility,
systems upgrades or maintenance, or for other reasons. Symbols, prices, groups
and industries are used
for illustrative purposes only and do not constitute a recommendation.